Heterodyne Data Analysis
CLASS is used at the CSO for analysis of heterodyne data. CLASS is part of the IRAM GILDAS package. The entire package is available on the CSO computers. You may also install GILDAS on your own computer. Please refer to the GILDAS documentation for installation instructions, tutorials, etc.
Getting started
- Connect to kilauea with X window transport
mycomp> ssh -X user@kilauea.caltech.edu- Not necessary if you have installed GILDAS and transferred the data to your computer.
- Move to your data directory
kilauea> cd data_directory - Start CLASS
kilauea> class - Open a graphics window, if necessary
LAS> device image - Open the data file
LAS> file in mydata.cso - List the contents
LAS> list in - Choose a spectrum
LAS> get N - Plot the spectrum
LAS> plot
Data access
- Access the CSO computer
mycomp> sftp user@kilauea.caltech.edu - Move to your data directory
sftp> cd data_directory - Transfer data to your computer
sftp> get mydata.cso - End sftp session
sftp> exit
Example
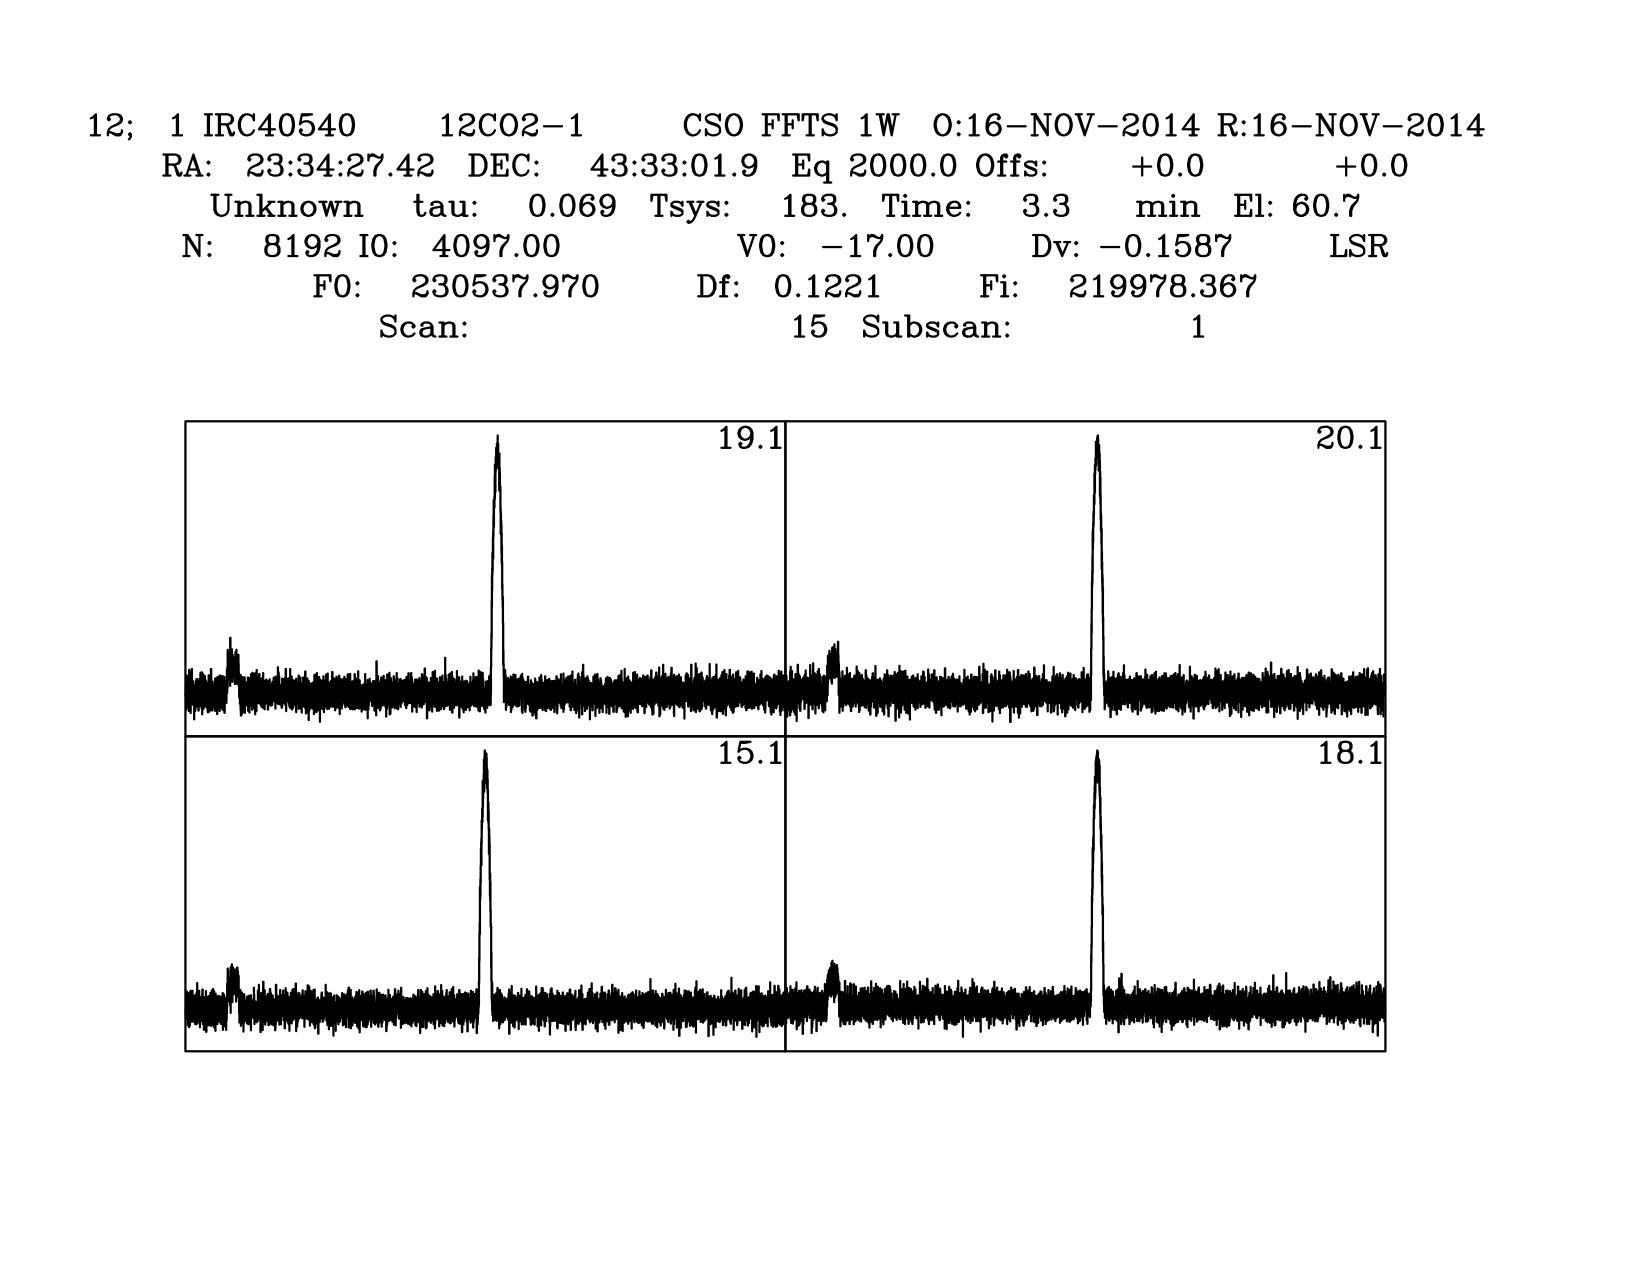
Analyse simultaneous observations of 12CO, 13CO, and C18CO in IRC 40540, an evolved star, made on 2114-11-16. During the observations, the receiver was tuned for 12CO(2-1) but a tuning shift was deliberately introduced between between the first spectrum and the others. For the receiver tuning, see Wideband Observations, Example 1.
- Data overview
- Notice the strong 12CO(2-1) line in the center and weaker 13CO(2-1) line on the left edge. C18CO(2-1) is not obvious.
- Notice the shift of the 12CO(2-1) line.
file in 2014-11-16.cso                      ! open data file
list in                                     ! list contents
find /source IRC40540 /tel "CSO FFTS 1W"    ! select FFTS1 data
stamp /scan
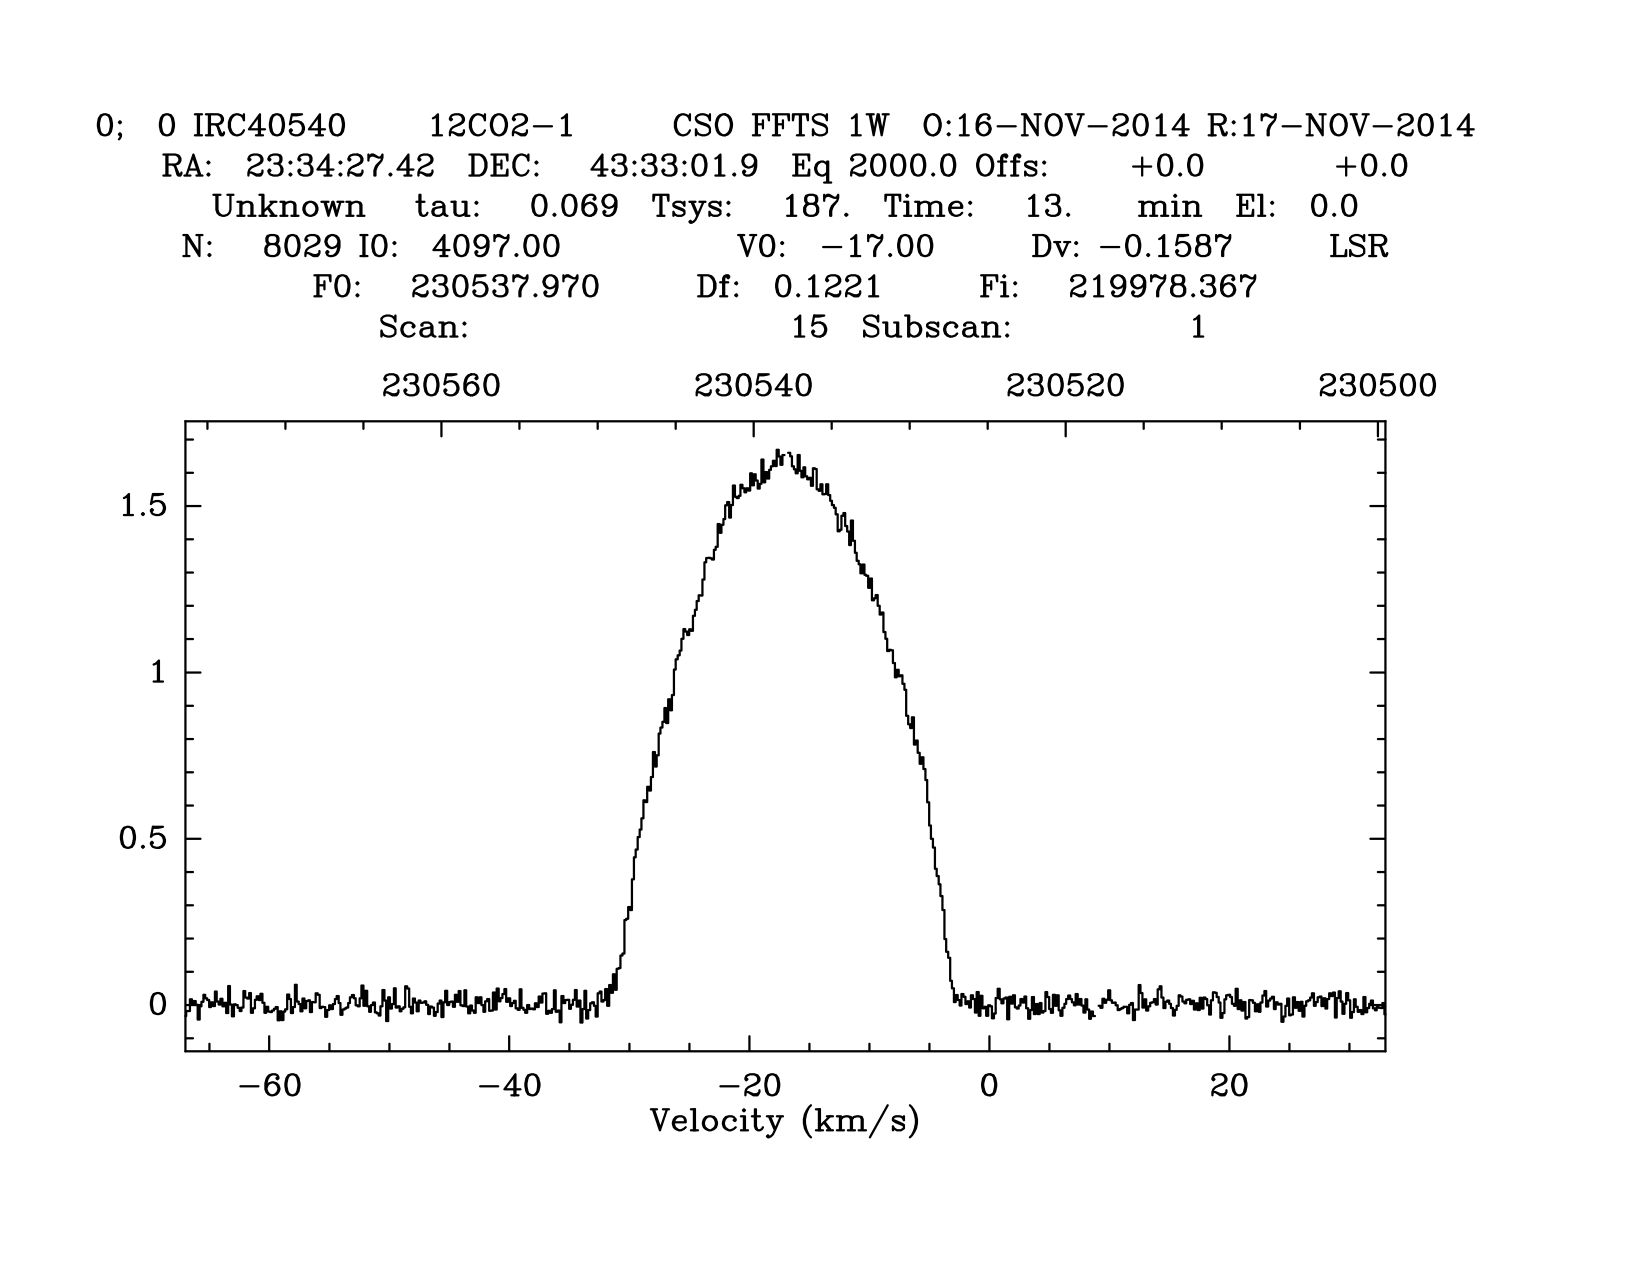
- Analyse 12CO(2-1)
- Because the receiver was tuned for 12CO(2-1), the sideband and reference information is correct for all four spectra. Hence the spectra may be averaged directly.
file in 2014-11-16.cso                      ! open data file
list in                                     ! list contents
find /source IRC40540 /tel "CSO FFTS 1W"    ! select FFTS1 data

set align v i                               ! select velocity alignment, intersect region
average /resample                           ! average the spectra
set unit v f                                ! set the display axes, velocity (bottom) and frequency (top)
set mode x -67 33                           ! set the display limits [km/s]
plot
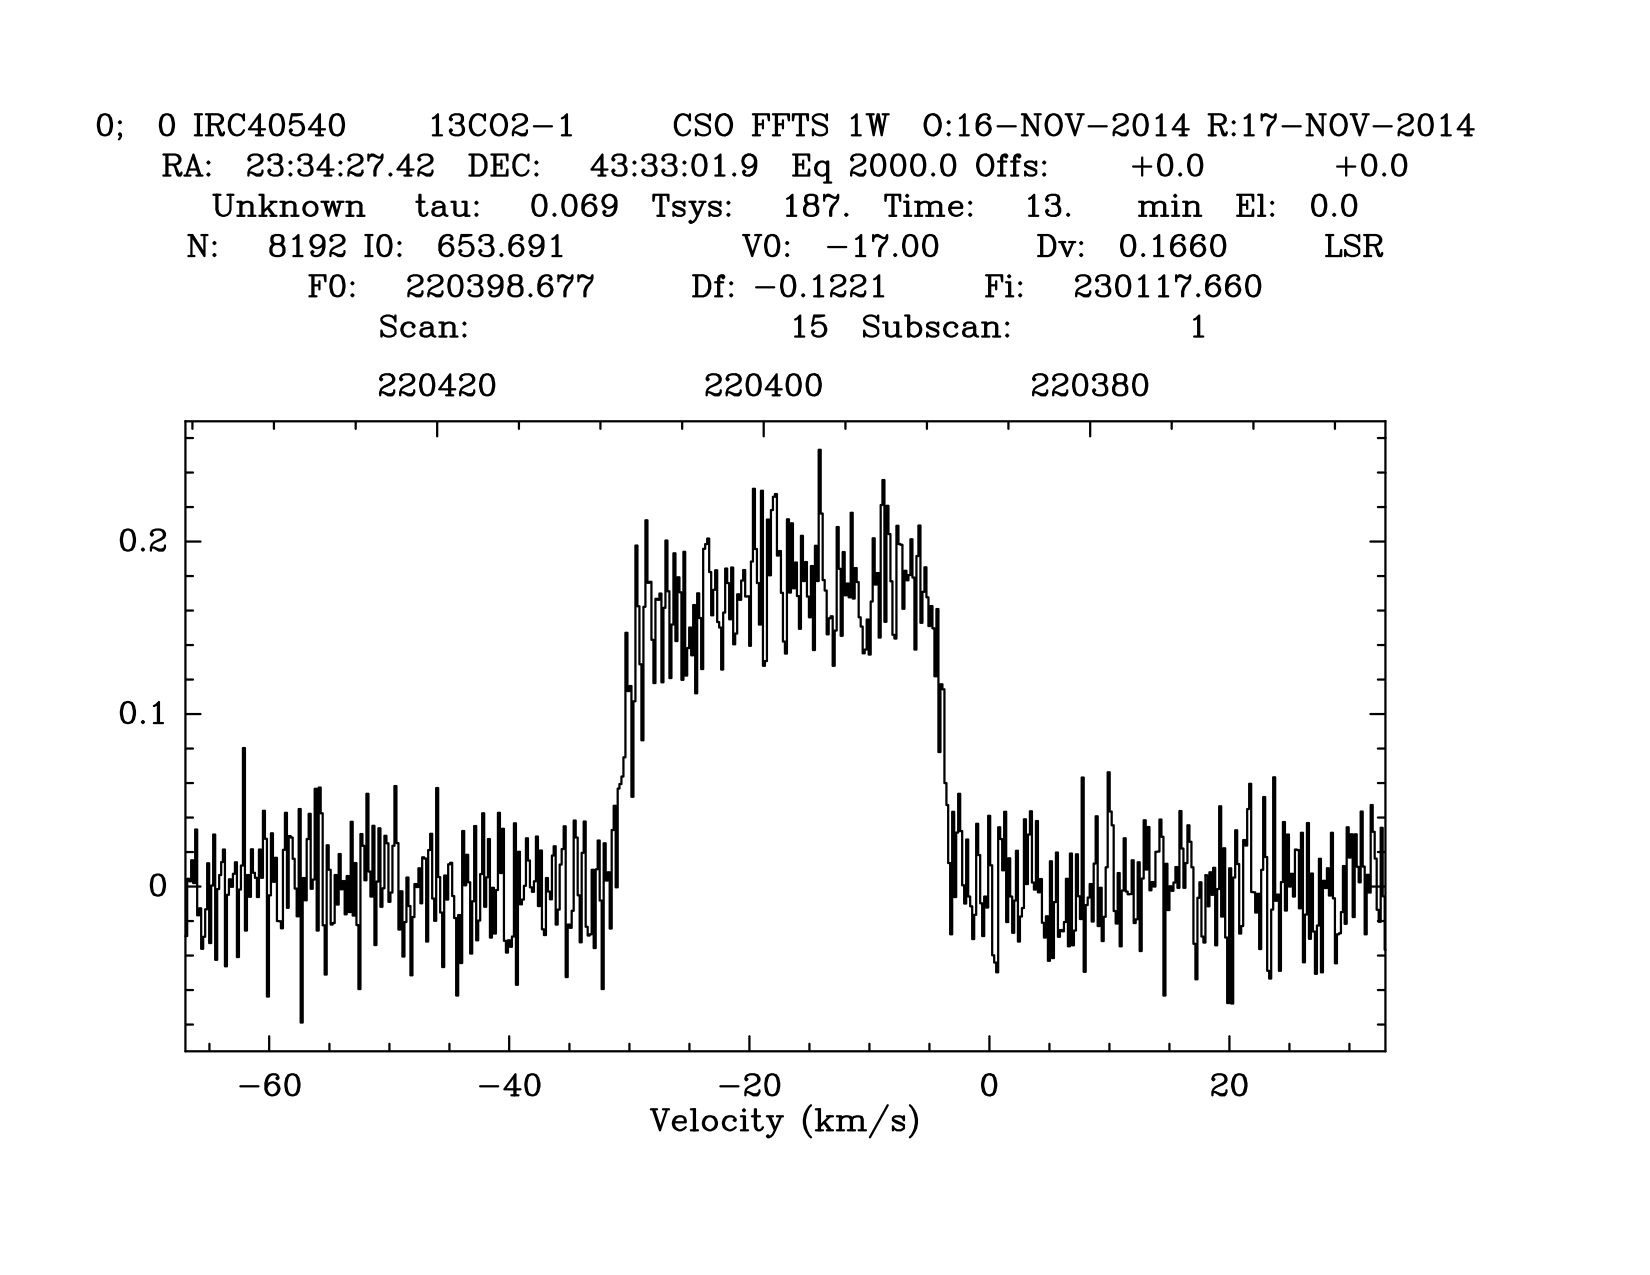
- Analyse 13CO(2-1)
- Because 13CO(2-1) is in the image sideband, the reference information must be updated before the spectra may be averaged. This requires an intermediate, scratch file.
file in 2014-11-16.cso                      ! open data file
list in                                     ! list contents
find /source IRC40540 /tel "CSO FFTS 1W"    ! select FFTS1 data

set variable spectro write                  ! enable modification of reference information
set variable calibration write
file out scratch1.cso multiple              ! open scratch file
for i 1 to found                            ! modify each spectrum
  get next
  let r%head%spe%line 13CO2-1               ! set line name
  @swap_sidebands 220398.6765               ! set reference info for 13CO(2-1)
  write
next

file in scratch1.cso                        ! open scratch file
list in                                     ! list contents
find /source IRC40540 /tel "CSO FFTS 1W"    ! select FFTS1 data
set align v i                               ! select velocity alignment, intersect region
average /resample                           ! average the spectra
set unit v f                                ! set the display axes, velocity (bottom) and frequency (top)
set mode x -67 33                           ! set the display limits [km/s]
plot
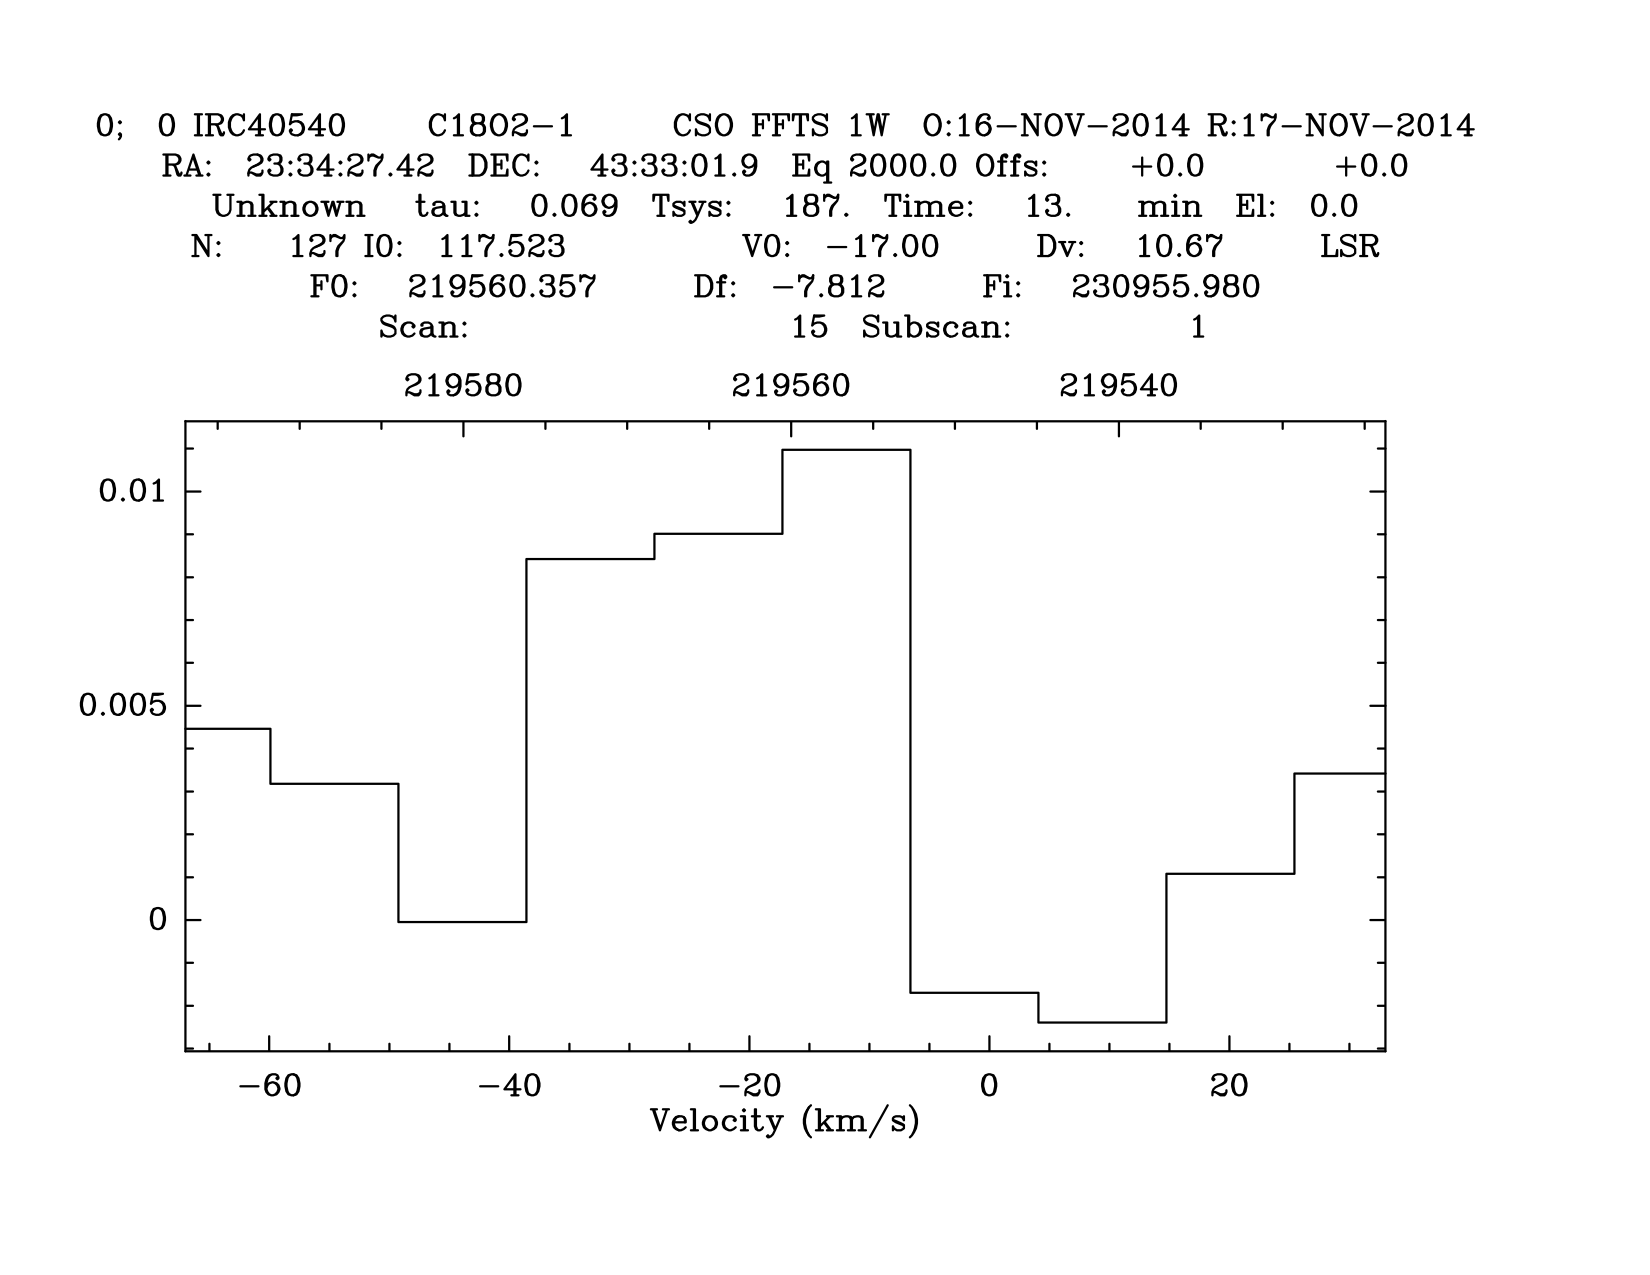
- Analyse C18O(2-1)
- Because C18O(2-1) is also in the image sideband, the reference information must be updated before the spectra may be averaged. This requires an intermediate, scratch file. Moreover, C18O is only barely detected so the spectral resolution must be reduced to see the line.
file in 2014-11-16.cso                      ! open data file
list in                                     ! list contents
find /source IRC40540 /tel "CSO FFTS 1W"    ! select FFTS1 data

set variable spectro write                  ! enable modification of reference information
set variable calibration write
file out scratch2.cso multiple              ! open scratch file
for i 1 to found                            ! modify each spectrum
  get next
  let r%head%spe%line C18O2-1               ! set line name
  @swap_sidebands 219560.3568               ! set reference info for C18O(2-1)
  write
next

file in scratch2.cso                        ! open scratch file
list in                                     ! list contents
find /source IRC40540 /tel "CSO FFTS 1W"    ! select FFTS1 data
set align v i                               ! select velocity alignment, intersect region
average /resample                           ! average the spectra
set unit v f                                ! set the display axes, velocity (bottom) and frequency (top)
set mode x -67 33                           ! set the display limits [km/s]
smooth                                      ! reduce spectral resolution by 2^6 = 64
smooth
smooth
smooth
smooth
smooth
plot


